
When a weather balloon (Radiosonde) is released into the air, it rises up through the air mass and sends back readings to a receiver in raw code. This cod is then plotted on a Skew-T diagram and is used to gather valuable data to determine the stability of the air mass. Data sent back from these weather balloons from weather stations across the country is used to create the surface and upper air weather charts that we use to breakdown the weather systems effecting our day to day weather.
Macroscale
Macroscale (the size of the US or larger). The size of macro scale is greater than 2000 km. The time scale is several days to several weeks. Some examples of macro scale phenomena are the jet axis and the atmospheres general circulation.

Synoptic Scale
Synoptic scale (weather map scale). The size of synoptic scale is 200 to 2000 km. The time scale is tens of hours to several days. Some examples of synoptic scale are frontal systems and tropical cyclones to include hurricanes and tropical storms.

Mesoscale
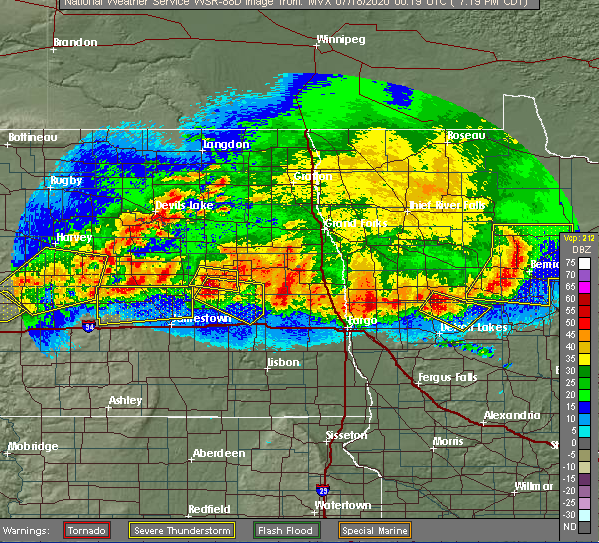
The size of mesoscale is 2 to 926 km or 1 to 500 nm (1 nm = 1.85 km). The time scale is tens of minutes to several hours. Some examples of mesoscale are thunderstorms and sea breezes.

Microscale
Microscale. The size of microscale is less than 2 km. The time scale is a few seconds to a few minutes. Some examples of microscale are turbulent flow (updrafts and downdrafts).
