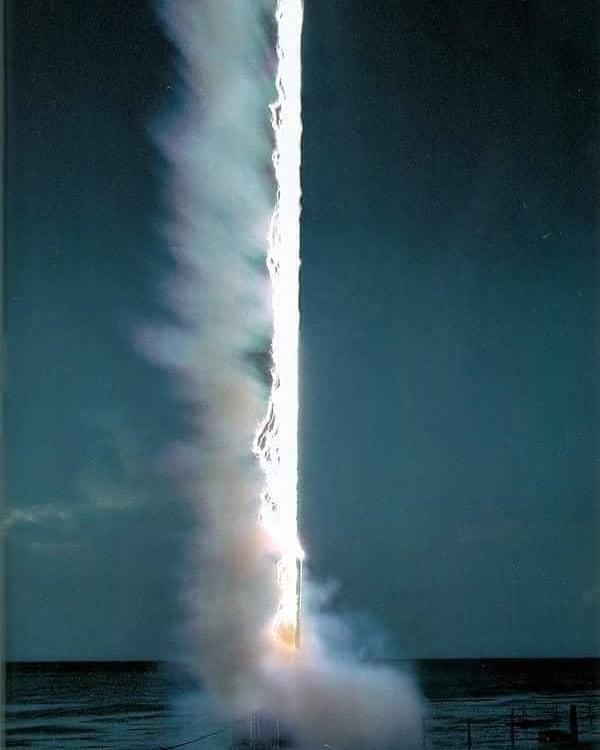
There is certain criteria that has to be met before a thunderstorm is considered to be severe. When a severe weather warning is put out, it is typically based on information that has been detected by radar or a Skew-T diagram indicating the stability of the atmosphere is favorable for severe conditions.
When determining severe weather conditions, we must look at the mesoscale and breakdown a significant weather feature such as a thunderstorm cell or a frontal boundary and the effects it will have on weather conditions.
The frontal systems associated with the movement of these air masses begin to get our attention focused on the mesoscale. Each cell that develops and becomes a potential weather maker will be watched on the mesoscale and then the microscale as they are needed be dissected with a cross section of the radar.
The mesoscale is where we analyze a weather phenomena within the macroscale such as a thunderstorm or a even a sea breeze. As a weather forecaster, we are always looking at the macroscale when we watch the jet stream and monitor the air masses in the region as they form and begin to move.
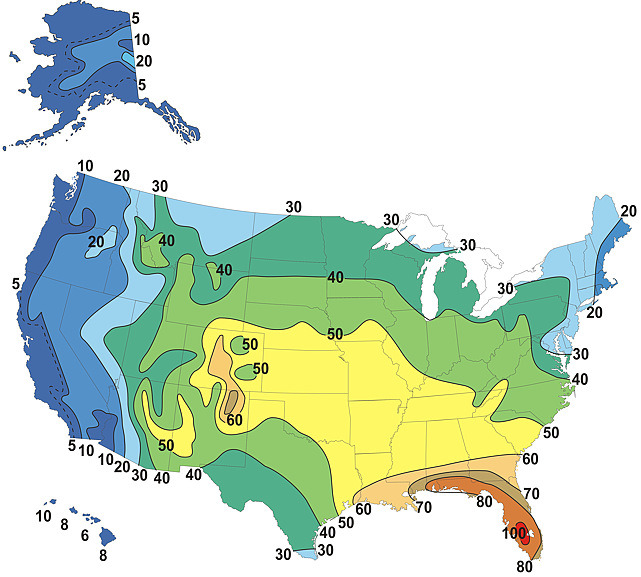
U.S. Thunderstorm Climatology
Thunderstorms occur most frequently over then Southeastern US. The favored season is during the warm summer months. This area is favorable for air-mass thunderstorm activity because of the destabilizing effect of abundant low-level moisture and surface heating. A secondary area of thunderstorm activity occurs during the summer nights over the Great Plains. This is due to the interaction of the low-level jet and nocturnal cooling. Frontal thunderstorms are mainly responsible for the activity over the rest of the country. Frontal thunderstorms occur year round.
Severe Thunderstorms & Tornadoes
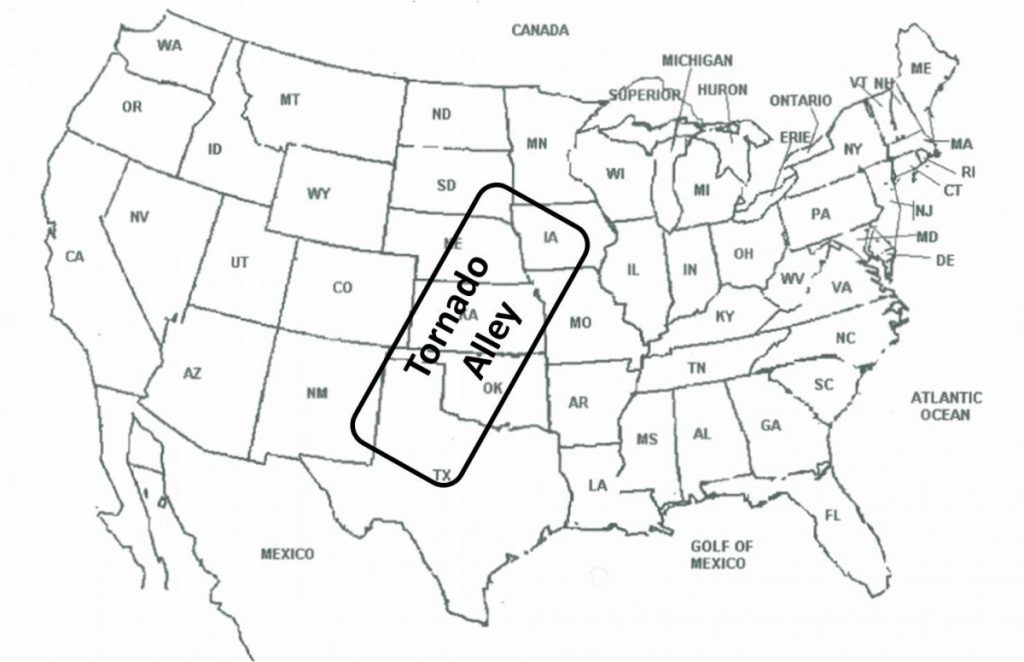
Generally, severe convective weather extends from the Continental Divide to the Appalachian Mountains, and Gulf of Mexico to Canada. The figure below indicates the favored area for tornadoes known as “Tornado Alley.” It includes northern Texas, Oklahoma, Kansas, and Nebraska. The season that favors tornadic activity is March through June, and March through September for severe thunderstorms. They can occur anytime when conditions are favorable. These storms prefer a baroclinic state when warm moist air clashes with the cool dry air during the transitional seasons. Air mass boundary zones include: cP (Canada) with mT (Gulf of Mexico) associated with the polar front and mT with cT (Mexico, southwest US) associated with the dryline.
Tornadoes decrease during the summer due to the lack of strong dynamics aloft (Polar-Front Jet or PFJ), and low-level thermal contrast. The favored area shifts with the position of the PFJ. The figure below displays the PFJ shift from the Gulf Coast states in the winter, to the southern Plains in early spring. During the mid spring, the PFJ will be over the Central Plains and Midwest. Through late spring and summer, the jet migrates over the Northern Plains and Great Lakes region. Tornadoes are faster and stronger during late winter/early spring (strong PFJ/low-level thermal gradient), and they are slower and weaker during late spring/summer.
Severe thunderstorms/tornadoes are diurnally prevalent during the late afternoon/evening (max. surface heating), and in the early morning during winter along the Gulf Coast (radiational cooling aloft). These are times of maximum atmospheric instability.
Heavy Rain
This event has no diurnal variation. Slow moving or stationary convective cells produce heavy rain over the Southeast US during the summer months. The focus shifts to the Gulf Coast region in August-September (tropical cyclones). The area of heavy rain-fall relocates to the west coast in the winter. The western coastal mountains are bombarded with maritime frontal systems.
Equal or greater than 2 inches of rain within 12 hours

Flash Flooding
A flash flood is one that rises and falls quite rapidly with little or no warning usually as a result of intense rainfall over a relatively small area. Convective storms account for most flash flood events.
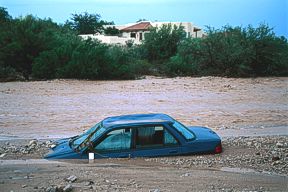
The majority of flash flood cases take place during the warm season (April – September) with July being the predominant month (non-tropical in origin). Most flash flood events are nocturnal. The eastern US (east of the Rocky Mtns) events were longer in duration with greater rainfall amounts compared to western US (west of the Rocky Mtns). Some common synoptic characteristics have been associated with flash flooding. Heavy rains were produced by regenerative convective storms. Surface dew-point temperatures were very high and large moisture contents were present through a deep tropospheric layer. Vertical wind shear was weak to moderate through the cloud depth.
Thunderstorm Climatology Review
Thunderstorms
Thunderstorms are noise-making machines that create a variety of weather phenomena: lightning, strong winds, hail, turbulence, icing, and heavy rain.
Affects On Ground Operations
Lightning usually stops refueling operations due to the explosive situations that exist on most flight-lines. Personnel, who work outside, must limit their time because of the probability of being electrocuted. Computer centers on base/post must use back-up power, e.g., Air Traffic Control and Command Post.
Strong surface winds can accompany thunderstorms. Strong winds will move objects around if not secured. Surface wind speeds up to 49 kt generally move small objects around the flight-line and reduce the visibility due to blowing dust and debris. Wind speeds > 50 kt can cause damage to structures on the facility. Large aircraft could also be blown around the flight-line and smaller objects may become projectiles.
Hail < 1 inch is a danger to personnel in exposed areas and will damage weak structures, i.e., windshields in vehicles.
Hail > 1 inch could seriously injure personnel in exposed areas and will do significant damage to exposed aircraft, vehicles, and facilities.
Heavy rains may affect ground operations. Heavy rain reduces visibility and can cause flooding in low lying areas.
Characteristics Of Tornado Activity
Tornado location & Appearance
Tornadoes appear as a funnel-shaped cloud pendant from the base of cumulonimbus (CB) cloud and/or a swirling cloud of dust and debris rising from the ground. Tornadoes usually appear in the right rear area of the CB. This is where the inflow is entering the storm updraft core. The wall cloud usually represents the area of the updraft. Tornadoes generally form on the periphery of the wall cloud.
Tornado Movement
Tornado movement is governed primarily by the motion of the parent thunderstorm. Average movement is from SW to NE with an average speed of 30 mph. Smaller scale motion can be in any direction as the tornado often moves in a circular pattern under the parent thunderstorm. Smaller scale speed is controlled by the tornado motion under the parent thunderstorm. Speeds from 0 to 70 mph have been observed.
What Makes A Tornado So Destructive?
Wind-shear is the main reason for tornadoes being so destructive. Calm wind is often observed just before a tornado onset. In a matter of a few seconds, speeds could go from 0 to 200 mph. Directional wind-shear of 360° occurs in a matter of seconds when a tornado moves across a structure.
The Bernoulli Effect The Bernoulli Effect (airfoil effect). The increasing winds over an object will create an area of lower pressure. Due to the pressure imbalance, this shift causes a roof to become detached on homes whose roofs aren’t well attached. This can cause the walls to fall outward, given the impression that the house exploded.
Over-pressurization can cause a rapid decrease in pressure outside the house which is common during a tornado passage. This effect would be multiplied if doors, windows, or garage doors were blown open on the upwind side. Mass and pressure would build up inside the house, again giving the impression of an explosion.
Tornado damage is rated by the Fujita-Scale: In the late 1960’s, Dr. T. Theodore Fujita, A noted authority on tornadoes, proposed a scale for classifying tornadoes according to their rotational wind speed and damage.
| Number | Wind Speed | Damage |
| F0 | Up To 72 mph | Light |
| F1 | 73 – 112 mph | Moderate |
| F2 | 113 – 157 mph | Considerate |
| F3 | 158 – 206 mph | Severe |
| F4 | 207 – 260 mph | Devastating |
| F5 | > 261 mph | Incredible |
Don’t Be Fooled By A Tornado Look-Alike
Tornado Look-alike. There are many tornado look-alikes. Mammatus clouds are sometimes believed to be the initial stage of a tornado. Mammatus clouds are formed due to subsidence and are quite harmless at the surface. They occur at all levels within the thunderstorm, and they are often seen immediately after the passage of a rather violent thunderstorm. Roll clouds form along the advancing gust front and exhibit rotation about a horizontal axis. Ragged shelf clouds, virga, and rain shafts are often confused for wall clouds or tornadoes.
Remember the location of the wall clouds or tornadoes with respect to the thunderstorm. Occasionally, tornado-like vortices will form along gust fronts. Although not really tornadoes, they can inflict damage. They are very short-lived and do not allow for any real warning capability.
Convective Atmospheric Dynamics
The Skew-T diagram is used to determine the stability of the atmosphere by using several measurements at different levels of the atmosphere. This diagram can help a forecaster determine everything between the level clouds will form to the height aircraft will leave contrails.
Lifted Condensation Level (LCL) is the height at which a parcel will become saturated when lifted by a mechanical force. Clouds will begin to form when air becomes saturated and water vapor condenses.
Convective Condensation Level (CCL) Height at which a parcel of air, if
heated sufficiently from below, will rise adiabatically until condensation occurs. It is the height of the base of cumuliform clouds which are or would be produced by thermal convection solely from surface heating. Severe weather usually occurs when the CCL is at or below 770 millibars.
Environmental Temperature (ET) is the temperature of a sounding.
Positive Energy Area (PEA) Positive area denotes the buoyancy of the atmosphere. The higher the positive area, the more buoyant energy available. Values in excess of 500J/KG support T-storms, values between 1000 and 3000 J/KG support T-storm development with moderate shear
Level of Free Convection (LFC) The height at which a parcel of air lifted dry adiabatically until saturated, and saturated adiabatically thereafter would first become warmer than the surrounding air, and then continues to rise until it becomes colder than the surrounding air. Severe weather usually occurs when the LFC is at or below 650 millibars.
640 mb – 745 mb Moderate
745 mb – 850 mb Strong
The LFC is the first level in the atmosphere where the temperature of a parcel raised from the surface is greater than the surrounding environment. This means that the parcel is now free to continue rising without the need of any additional energy input from the environment – hence it is “free” to continue convecting.
The LFC is the dividing level between the negative (CINH ) and positive (CAPE) energy regions on the skew-T diagram. It represents the point where the environmental sounding first intersects the parcel sounding, raised from the surface. The LFC for a sample sounding is shown below.
Note: Some soundings may not even have a LFC. This can occur in cases with dry low-level conditions or warm upper level temperatures, especially with sounding temperature inversions. In such circumstances the atmosphere can be considered ultra-stable, with no chance of convection. The height at which the LFC occurs can be used as general guidance for predicting the chances of convection. See the table below the sounding.
Equilibrium Level (EL) Height where the temperature of a buoyantly rising parcel of air again becomes equal to the temperature of the surrounding air. Usually, if thunderstorm echo heights are above this equilibrium level, it is referred to as ‘Over-Shooting Tops’ and is a precursor to severe weather.
CAPE (Convective Available Potential Energy) is defined as the positive energy available for storm growth.
(PW) Precipitable Water The amount of water that would be found in a column of air above the surface. Comparing sounding values indicates the amount of water available for rain or snowfall potential.
(SCT) Convective Temperature The surface temperature that must be reached to begin formation of convective clouds by solar heating of the surface air layer.
(HSZ) Hail Size The size that hail may reach given the state of
atmospheric updrafts. This is based on the calculation of critical
updraft speed which determines the size of hailstones that can stay
aloft for a given updraft speed.
(STC) Richardson Shear Index This value indicates how turbulent the
flow is. Low RI numbers are associated with fast moving systems in an environment that has strong shear. Small RI numbers support greater shear
(TTI) Total Totals Index This index determines the potential for T-storms and is very helpful in diagnosing the difference between weak and strong T-storms. The relationship between the TTI and Thunderstorm Activity is as follows:
44 – Spotty, usually light thunderstorm.
46 – Spotty, usually moderate thunderstorm.
48 -Usually heavy thunderstorm.
50 – Usually heavy thunderstorm with hail possible.
52 – Usually heavy thunderstorm with a tornado possible.
56 – Heavy thunderstorm with tornadoes likely.
(SSI) Showalter Index A stability index similar to the Lifted Index, but values are typically not as low for severe weather. Generally, an index of +3 to +1 supports T-storms and <-3 supports severe weather.
(SI) Sweat Index Stability index indicating severe T-storms and
tornado potential.
(VTI) Vertical Totals Index This index determines the vertical transport of unstable air. Values in excess of 25 are needed for strong T-storms.
(CTI) Cross Totals Index This index determines the horizontal transport of unstable air. A value in excess of 25 is needed for strong T-storms
(WBZ) Wet Bulb Zero Height Height where wet bulb reaches zero. Generally, if the wet bulb zero height ranges between 7,000-9,000 feet, large hail, damaging winds, and tornadoes are possible. At the Gulf Coast, the range must be between 9,000-10,500 feet for damaging winds and hail to occur.
(KI) K-Index Stability index useful in predicting non-frontal thunderstorm situations.
Relationship of K-Index to probability of thunderstorms:
K 15-20: < 19%
K 21-25: 20-39%
K 26-30: 40- 59%
K 31-35: 60-9%
K 36-40: 80-89%
K >40: >90%
Convective Scale Atmospheric Dynamics
Convective Ingredients – The four basic ingredients for thunderstorm formation are instability, moisture, lift, and an exhaust.
Instability
Instability is defined as a condition of the atmosphere where by a parcel of air, given an initial start vertically, then continues to move upward without any outside force. Our atmosphere is considered to be conditionally unstable on thunderstorm days.
Instability can be caused by heating, an increase of low-level moisture, cooling in the upper levels, and a decrease in mid to upper-level moisture. Diurnal heating is a destabilizing process. As the sun heats the earth, the boundary layer warms, decreasing stability.
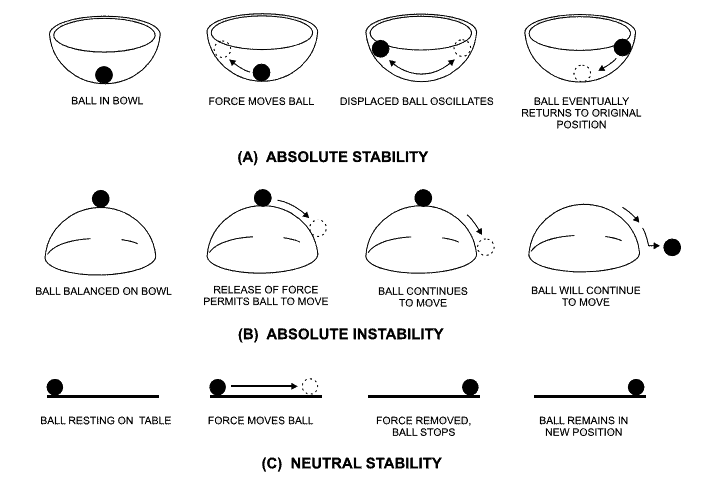
Moisture affects the stability of the atmosphere. Instability is very dependent on the depth of the moisture layer. The depth of the moist layer must be deep enough that afternoon mixing will not draw drier air from aloft into the boundary layer and reduce the instability to the point where convection is suppressed.
Cooling aloft will also destabilize the atmosphere. This process can come in several forms, i.e., cold thermal trough in the mid and upper levels, evaporation, and radiational cooling of cloud tops. We understand the process when cold air is situated above warm air – it will destabilize the atmosphere.
Evaporational cooling can occur when dry air is advected into a moist area. The mixing of dry air in the mid-levels of a cloud will create a density gradient within a cloud. This effect usually strengthens the updraft of a thunderstorm. This process of mixing environmental air into the growing cloud is known as entrainment.
Moisture
Increased moisture in the low levels will modify the dew point which will lower the CCL, LCL, and the LFC. As a saturated parcel is lifted and cooled, latent heat is released into the atmosphere. This process slows the cooling rate of a parcel as it ascends through our atmosphere. If this rate is less than the environmental lapse rate, the parcel will continue to rise after it reaches the LFC.
Lift (Trigger)
Before a parcel can reach its LFC, it must have a force that initiates the upward vertical motion. This lift can be on a synoptic or mesoscale. Synoptic scale lift, by itself, will not trigger convection; it does produce an environment that is conducive to the development of deep moist convection. It can increase the lapse rate that will reduce the negative energy area below the LFC; making it easier for near-surface parcels to be pushed upward to the LFC. Examples of Synoptic Scale Lift are mid- and upper-level short-wave troughs, jet stream maxima, and warm air advection.
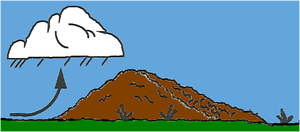
Mesoscale lift causes the majority of thunderstorms in the US. Low-level convergence is possibly the most important parameter. It provides the mechanical lift needed to push a parcel to the LFC. A mesoscale near-surface convergence zone is produced by 3 factors: boundaries, topography, and differential heating.
Boundaries refer to any low-level, quasi-linear discontinuity characterized by cyclonic shear and convergence. Examples are fronts, troughs, outflow boundaries, and moist discontinuities (dry-lines). Colliding convergence lines will initiate storms, or they will intensify existing ones.
Topography is a less obvious factor. Often a subtle lifting mechanism is the convergence produced by near surface wind flow interactions with terrain. Differential heating is the last factor for producing boundary layer convergence zone. A strong temperature gradient over a short distance can create a mesoscale circulation that has a potential for upward motion sufficient to carry boundary layer air to the LFC.
Exhaust
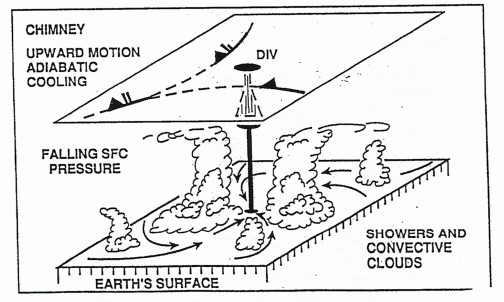
As convergence occurs in the low-levels of the atmosphere, there must be an exhaust for thunderstorms. Upper-level divergence is required. Upper-level divergence will not produce thunderstorms, but it will enhance the process.
Recent Posts
Determining Severe Weather Based On Stability Indexes and Upper-Level Winds
There are several weather products used to determine the possibility of severe weather for an area. The most common and misunderstood by many weather enthusiasts is the Skew-T chart and the upper-air...
Tornado Basics, Severe Weather Preparation, & The Enhanced Fujita scale
Earth's weather can produce various kinds of windstorms which include waterspouts, dust devils and tornadoes. Although they have the common features of a column of rotating air, they are actually...

