
All atmospheric synoptic scale systems either thrive or die with the abundance or lack of divergence aloft. You can judge the intensity of of a system by how far it extends into the upper levels and if it has a vertical stack or a tilted stack.
An illustration of upper level divergence would be if you turned your ceiling fan on and had the rotation set for a clockwise rotation or blowing up toward the ceiling. When the air being pulled from the floor below the fan reaches the ceiling, it has no place to go but out. This is a picture of divergence aloft.
When an updraft occur in a weather system, it is either caused by low level convergence, a heated surface causing an updraft or the jet stream could act as an air flow being blown over a tube creating a vacuum.
Divergence
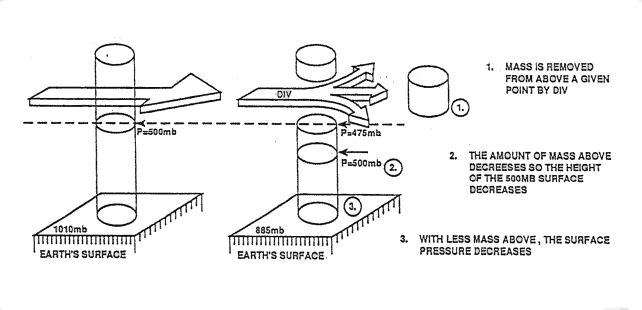
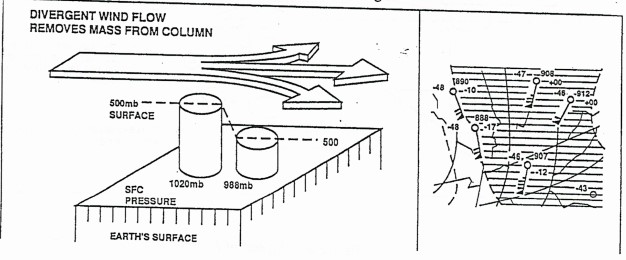
The divergence of a wind field is a measure of the net removal of mass out of a volume of air above a given point.
Convergence
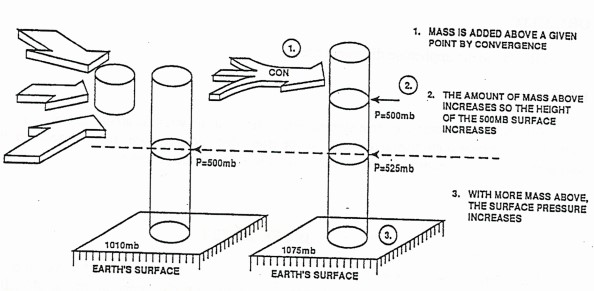
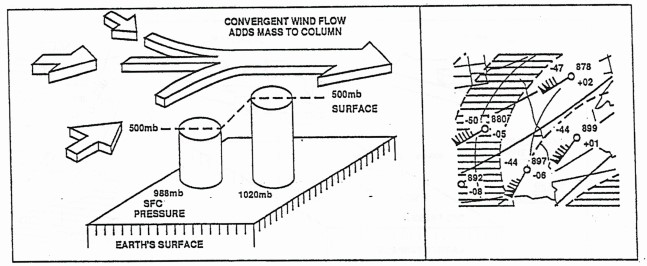
The convergence of the wind field is a measure of the rate of the net addition of mass into a volume above a given point. The effect of convergence is to promote surface pressure and height rises.
Main Components
Direction and speed are the main components of the wind flow patterns that cause divergence and convergence.
Wind Direction
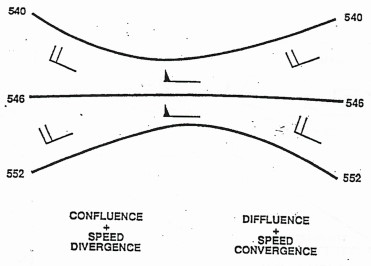
Directional Diffluence is the spreading of wind flow and contours, which results in mass being removed from an area.
Directional Confluence is coming together of wind flow or contours which results is mass being added to the area.
Wind Speed
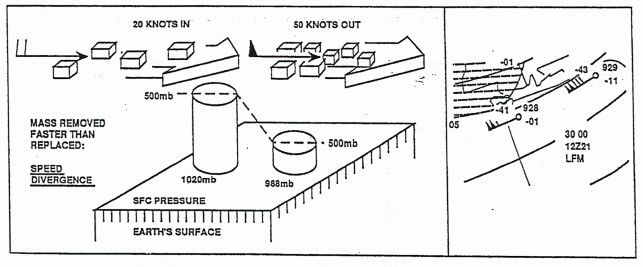
Speed divergence is cause by winds rapidly increasing speed downstream on the pressure surface. High wind speeds will pull mass out of an area faster than it can be replaced by the slower wind speeds, thus decreasing the mass.
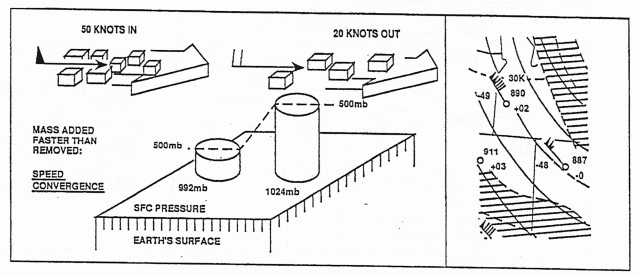
Speed Convergence is caused by winds rapidly decreasing speed downstream. The higher wind speeds push mass into an area faster than it can be removed by the slower wind speeds, thus increasing the mass.
Wind direction and speed will offset each other on constant pressure charts. As contour (or Isobar) spacing increases or decreases, wind speeds will increase or decrease to remain a balance of forces. Therefore, divergence (removal of mass), or convergence (addition of mass) are difficult to evaluate on a constant pressure chart. The vorticity chart is used to determine the vertical motions and if net divergence or convergence is occurring aloft.
The Effects Of Convergence And Divergence
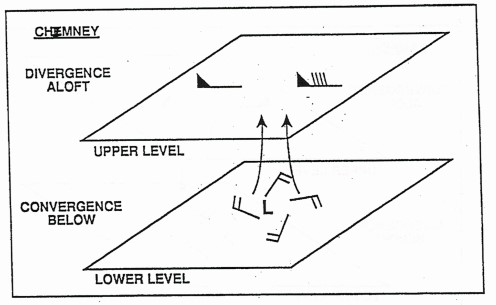
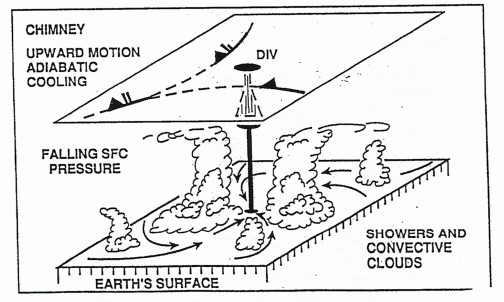
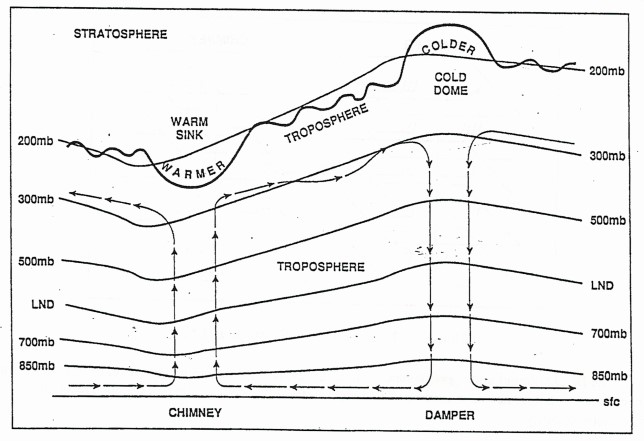
The Chimney Effect
If divergence is occurring in the upper troposphere the atmosphere will attempt to compensate by initiating convergence in the lower troposphere, this is called the chimney effect.
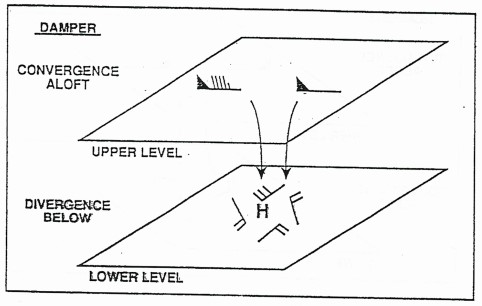
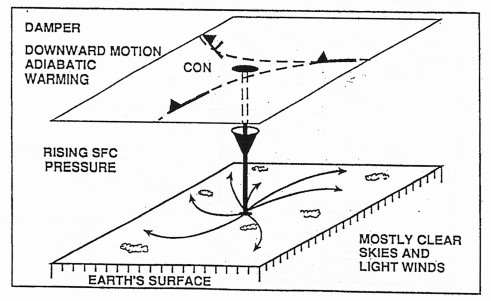
The Damper Effect
If convergence is occurring in the upper troposphere the atmosphere will attempt to compensate by initiating divergence in the lower troposphere, this is called the damper effect. This condition results in downward vertical motion and adiabatic warming, which could represent improving weather with increased stability. If convergence aloft is stronger than divergence at low levels, surface pressure and constant pressure surfaces will rise. If the convergence is weaker than the divergence, surface pressure and constant pressure surfaces will fall despite the downward vertical motions.
Level Of Non-Divergence
Convergence or divergence aloft results in the opposite effect in the lower troposphere; therefore, there must exist at some level in the atmosphere a level of non-divergence (LND)
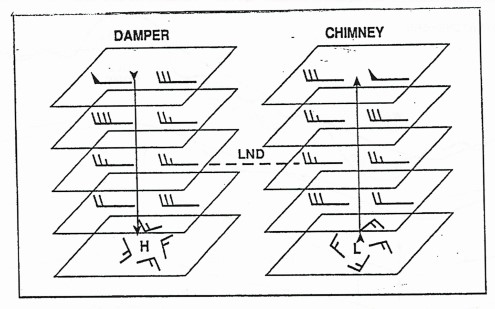
The LND is found under average conditions around 600mb and marks the level of transition from convergence to divergence and visa/versa. The height of the LND will be highly variable, based on the atmospheric stability.
Divergence in the upper levels and convergence in the lower levels results in upward vertical motion and adiabatic cooling, which could represent deteriorating weather as stability changes. If the divergence aloft is stronger than the convergence at the lower levels, surface pressure and constant pressure surfaces will fall. If the divergence aloft is weaker than the convergence in the lower levels, then the surface and constant pressure surfaces will rise.
Horizontal Divergence & Convergence
At lower levels, within the boundary layer, friction disrupts the geostrophic balance of forces and causes winds to cross the isobars toward lower pressures. This is called boundary layer convergence (BLC) around surface lows and boundary layer divergence (BLD) around surface highs.In the upper levels, the gradient wind relationships produce the divergence and convergence associated with the atmospheric waves. Near the tropopause, strong convergence and divergence patterns are produced by the jet stream maxima.
Above the tropopause, due to changes in height of the tropopause caused by the replacement and displacement of mass, warm and cold pockets are found at 200mb and 300mb levels above areas of strong divergence and convergence. Warm sinks are warm pockets of stratospheric air evident to the 200mb chart, and found above strong upper level divergence which causes the height of the tropopause to sink with respect to the 200mb surface. Cold domes are cold pockets of tropospheric air evident on the 200mb chart, and found above strong upper level convergence which causes the height of the tropopause to raise with respect to the 200mb surface.
Effects Of Temperature Advection
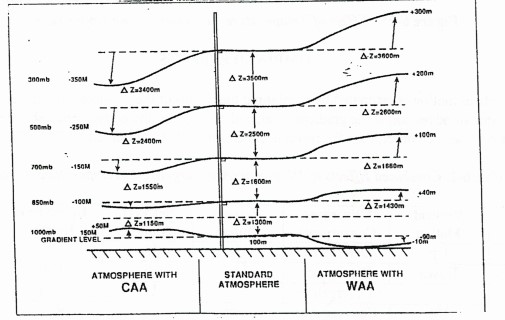
Effect on Height of Constant Pressure Surfaces
The 1000mb surface and sea level pressure are found below the gradient level, while 700mb level lies above the gradient level when the surface is smooth and located near sea level.The 850mb surface may be above or below the gradient level, depending upon the elevation and roughness of the terrain, stability and wind shear. Typically, in the eastern half of the U.S. the 850mb surface is above the gradient level, temperature advection is typically a maximum somewhere between the gradient level and 500mb.
Cold Air Advection (CAA)
Cold air advection is when wind flow is displacing warm, less dense air with cold, dense air. Therefore it will tend to sink (subsidence), Because the cold air is more dense, surface pressures and the 1000mb height surface will rise. Heights above the level of maximum CAA will fall. Heights and pressures below the level of maximum CAA will rise. The resulting effect is a decrease in thickness. Because the cold air sinks and causes subsidence, the vertical motion is downward.
Warm Air Advection (WAA)
Warm air advection is when wind flow is replacing cold dense air with warm, less dense air. Because the warm air is less dense, surface pressures and the 1000mb height surface will fall. Heights above the level of maximum WAA will rise. Heights and pressures below the level of maximum WAA will fall. The result is an increase in thickness. Since the air is warm and less dense, the vertical motion is upward.
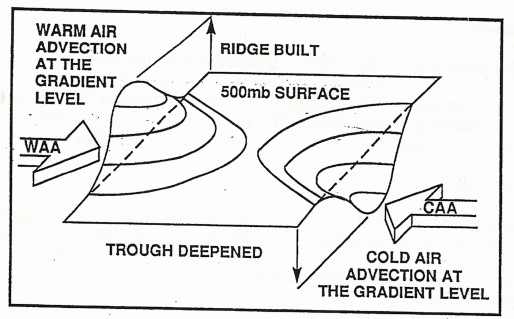
Effect of WAA & CAA on Upper Level Ridges & Troughs
Warm air advection at the gradient level into a ridge will build it at the upper levels (height rises), while cold air advection into a ridge will weaken it at upper levels (height falls)
Cold air advection at the gradient level into a trough will deepen it at the upper levels (height falls), while warm air advection into a trough will fill it at the upper levels (height rises).
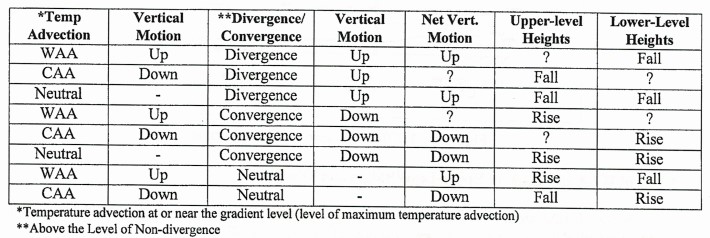
Combined Effects
The vertical motion is estimated by combining the results of the possible combinations of cold air advection, warm air advection at the gradient level, and convergence and divergence above the LND. When forces oppose each other, then the result is indeterminable. Represented by ? below.
Temperature advection can be determined by analyzing thickness charts, such as the 1000mb-500mb or the 1000mb-850mb thickness charts, as well as the 850mb chart (700mb in mountainous regions) for determination of WAA or CAA.
The thermal wind relationship can also be applied to determine the temperature advection through a given layer of the atmosphere when the thickness or 850mb charts are not available.
Recent Posts
Determining Severe Weather Based On Stability Indexes and Upper-Level Winds
There are several weather products used to determine the possibility of severe weather for an area. The most common and misunderstood by many weather enthusiasts is the Skew-T chart and the upper-air...
Tornado Basics, Severe Weather Preparation, & The Enhanced Fujita scale
Earth's weather can produce various kinds of windstorms which include waterspouts, dust devils and tornadoes. Although they have the common features of a column of rotating air, they are actually...