
To understand frontal systems and the atmospheric dynamics, refer to the article on air masses and their source regions. Fronts are the separation between air masses and the leading edge of an air mass. There are various types of fronts as depicted on weather charts.
Terminology
An air mass is a large body of air with similar horizontal temperature and moisture (density) characteristics. Skew-T soundings throughout the air mass will be similar.
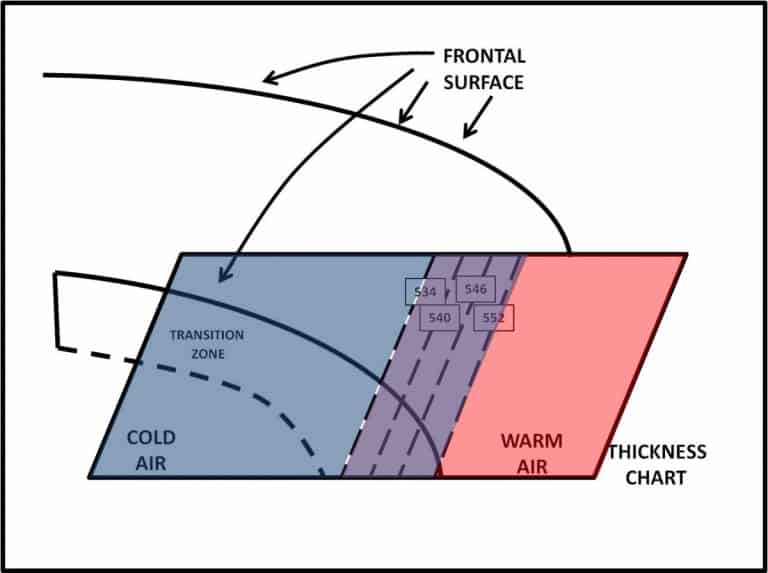
A transition zone (frontal zone) is a region of large horizontal temperature contrast between two air masses. The transition zone is characterized by a packing of thickness lines and isotherms (often called the thermal ribbon).

The frontal surface is the boundary separating one air mass from another. Across the frontal surface, distinct contrasts in temperature, moisture, and wind exist. The frontal surface is along the warm side of the transition zone.

The surface front is the intersection of the frontal surface and the ground. The term “front,” by itself, generally refers to a surface front.
A frontal surface aloft is known as the upper front.
A boundary is some feature which separates two air masses. Frontal surfaces, mountains and transition zones themselves can serve as boundaries between air masses. Troughing in the contours or isobars which is coincident with the frontal surface is known as a frontal trough. The frontal trough is most distinct at low levels.
The region depicted on a Skew-T sounding which corresponds to the transition zone is called the stable layer. The stable region could have a negative, isothermal or weak positive lapse rate. This feature is commonly called a frontal inversion. However, a true inversion need not be present. The base of the stable layer is the cold side of the transition zone. Below the stable layer lies the colder air mass. The top of the stable layer is the frontal surface. Above the top of the inversion lies the warmer air mass. The dew-point curve will follow the temperature curve and show a moisture increase with height through the transition zone. A change in temperature and moisture represents a change in virtual temperature. This, in turn, corresponds to the density difference across the front.
The frontal movement is strongly influenced by the perpendicular wind component in the cold air. The stronger the perpendicular component, the faster the front moves.

An important characteristic of a frontal surface is its slope. The slope is defined as RISE over RUN. Frontal slope is the ratio of the height of the upper front at some location (RISE) to the distance between that location and the surface front (RUN). Frontal slope is significant because it represents the POTENTIAL lift in a frontal zone. The ACTUAL lift depends on the wind flow in the frontal region. A steep slope suggests the frontal lift could be strong thus the wind flow forces air to ascend ahead of the frontal surface. A shallow slope suggests the frontal lift would be weak, thus the wind flow allows air to ascend the frontal surface.
While viewing diagrams of fronts, it is important to realize the drawings are not to scale. The actual slope of a frontal surface is much less pronounced than normally depicted on diagrams. If drawn to scale, even a steep front would have a slope which is hard to detect. A slope of 1/20 drawn to scale means that over a distance of 20 inches in the horizontal, the line changes only 1 inch in the vertical. In the planetary boundary layer, frontal slope is much steeper. Fast moving fronts may have an almost vertical slope in the boundary layer because of frictional drag. The slope shown below is 1/50. A front with this slope would be considered steep!!
Determination of Frontal Slope. When measuring the height of the frontal surface (RISE), several approximations are used: 5000 ft = about 1 mile, the 850-mb level is 1 mile high. and 700-mb level is 2 miles high. This is valid in the eastern U.S., or wherever terrain is near sea level. In the elevated regions of the West, the 850mb level is the surface and the 700-mb level is 1 mile high. When measuring the horizontal distance (RUN) from the surface front to the location beneath the upper front, the following approximation is used: one degree of latitude is equal to 60 nautical miles. To account for the distortion which is built into the map projections used on weather charts, it is important that the number of degrees of “run” be estimated at the same latitude that the measurements were taken.
TYPES OF FRONTS
Cold Front
A front in which a colder air mass is advancing, and displacing a warmer air mass is a cold front. Cold fronts are depicted by blue line with triangles pointing in the direction of motion. In the following paragraphs, we’ll examine the structure and types of cold fronts.

Cold fronts nearly always extend anywhere from a south direction to a west direction from the center of low-pressure areas and never from the center of high-pressure systems.
Cold Front Structure
A horizontal temperature discontinuity exists across the frontal surface. A warmer air mass ahead of the frontal surface and a colder air mass behind it.
The surface front is located on the warm side of the transition zone. The thickness packing is on the cold side of the front.
There is a moisture discontinuity across the frontal surface.
A pressure tendency is observed if the front has passed the station in the past 3 hours. If it passed more than 3 hours ago, the pressure will show a steadier rise (/). Pressure falls are observed ahead the surface front because of the divergence aloft. Strong rises (PRESRR) are observed behind the surface front due to the cold-air advection.

The frontal surface slopes over the colder air mass and is identified as the warm side of the transition zone. At 850-mb, the upper front marks the intersection of the frontal surface with the 850-mb constant pressure surface. Appreciable cyclonic turning usually occurs across the 850-mb upper front. Above the 850-mb, a frontal trough is usually not found, although strong fronts may be clearly defined up through 500-mb. The slope of a cold front is typically between 1/50 and 1/150. Fronts with steep slopes generally are visible up through 500-mb while shallow fronts may extend only to 850- mb and not above.
An upper-air sounding originating on the cold side of the surface front will exhibit backing winds in the vertical within the stable layer (Recall: The wind backing with increasing height indicates cold-air advection.)
Cold Front Types
Slow-moving Cold Front. Cold fronts can be divided into two types based on the motion of air relative to the moving front (Sansom, 1921). A cold front in which the wanner air mass is forced to ascend the frontal surface is a slow-moving (active) cold front. All clouds and weather associated with this type of front are widespread and are found at and well behind the surface front position, thus the term active.
The 850mb-700mb wind component (in warmer air mass directly above the frontal surface) is parallel to the front and is slower than the frontal movement. This results in the lifting of the warm air up the frontal surface. Slow-moving cold fronts typically have a shallow slope that remains fairly consistent along the length of the front.
Thickness lines within the transition zone are uniformly packed along the length of the front as shown in. The tightest thickness packing is located close behind the front and remains a uniform distance behind the front throughout its length. As the colder air mass behind the front advances, little change in depth occurs. Since the depth of the colder air mass varies little at different locations behind the front, the average virtual temperature/ thickness remains relatively uniform along the length of the surface front.
The polar-front jet (PFJ) parallel to and above the cold side of the surface front. A large area of precipitation and cloudiness exists behind the surface cold front because of the large scale upward vertical motion in this area.
The passage of the-front is normally marked by a sharp drop in temperature and a pronounced wind shift. The air behind the front remains moist.
Fast-moving Cold Front
The second type of cold front is the fast-moving (inactive) cold front. Unlike slow-moving cold fronts, warmer, dryer air aloft (located above the frontal surface) descends the frontal surface, therefore limiting the amount of moisture allowed to ascend any portion of the frontal surface in the low levels. All clouds and weather associated with the front are found at and/or ahead of the surface front position in a relatively narrow band, thus the term inactive.
The 850mb-700mb wind component perpendicular to the front (in the warmer air mass directly above the frontal surface) is faster than the frontal movement. This causes the warm air to sink down the frontal surface. (Some lift does occur in the boundary layer near the surface front.). The frontal surface has a shallow slope above 900-mb which becomes steep close to the Earth’s surface.
Moving equatorward within the transition zone, the thickness packing., and therefore the thermal contrast, decreases. The distance between the surface front and the tightest thickness packing is small at higher latitudes and increases equatorward.
As the colder air mass advances behind a fast-moving cold front, it spreads out in the horizontal and shrinks in the vertical. The depth of the colder air mass shrinks most where horizontal spreading is the greatest, at lower latitudes. Because of this reduction in the depth of cold air, the average virtual temperature within the cold air behind the surface front increases, and the thickness gradient weakens. Strong cold-air advection in the transition zone leads to downward vertical motion and adiabatic warming which further erodes the low-level temperature contrast across the front.
The polar front jet is located well behind the surface front at lower latitudes. Its proximity to the surface front increases poleward.
A small area of intense convergence at the Earth’s surface along and ahead of the surface front favors the development of convective precipitation (squall line) in this region. The presence of convection is dependent upon the moisture content and stability of the warmer air mass. After FROPA, skies clear rapidly with the downward vertical motion along the frontal surface.
The passage of a fast-moving cold front is usually more difficult to detect than that of the slow- moving front. The wind shift and temperature decrease are more gradual than with the slow-moving front. A drop in relative humidity behind the front, following the frontal precipitation (squall line), is often the best indicator of FROPA.
The two cases described above are extremes. Some cold fronts will exhibit characteristics which are a combination of both. This results when the flow either up or down the frontal surface is weak. In any case, several techniques exist to differentiate between fast and slow moving cold fronts.
Classifying Cold Fronts
The best way to classify a cold front is to look at the 700-mb winds relative to the surface front position. If the 700-mb winds are perpendicular to the front, the front is considered to be a fast-moving cold front. If they are parallel, the front is considered to be a slow-moving cold front.
Another way to determine the type of cold front is to look at the vertical wind profile through the front. (While this method is not based on the physical cause of the vertical motion, studies have shown it works quite well.) Winds backing strongly with height through the transition zone indicate a slow-moving cold front. As a result, the wind component perpendicular to the front remains constant with height. Only weak backing of the winds is observed through the transition zone of a fast-moving cold front. As a result, the wind component perpendicular to the front increases with height.
A third way to estimate frontal type is to note the position of the polar-front jet in relation to the frontal position at the surface: (The thickness chart can be used to infer the position of the PFJ.) If the PFJ parallels the front along its entirety, it is considered a slow-moving cold front. If the polar-front jet approaches the front at some angle, the front is considered to be a fast-moving cold front.
Next we’ll examine the warm front in detail. In the case of the warm front, we don’t break them down into fast or slow moving.
Warm Fronts
A front in which a warmer air mass is advancing and replacing a retreating colder air mass is a warm front.
A horizontal temperature discontinuity exists across the frontal surface, with colder air ahead of the frontal surface and warmer air behind it.

Like cold front, warm fronts also extend from the center of low-pressure areas but on nearly always on the east side of the low.
Warm Front Structure
The surface front is located on the warm side of the transition zone.
A moisture discontinuity exists across the frontal surface. Air behind the warm front typically is more moist (in terms of an absolute measure of moisture) than air ahead of the warm front. In other words, the dew point increases with FROPA. However, the air ahead of the warm front is normally nearer to saturation than that behind the warm front because fallen precipitation is evaporating. So, the relative humidity decreases with FROPA. While the warm air behind the front holds more moisture, it is farther from saturation.
The surface and 850mb fronts are located in frontal troughs. Strong pressure falls (PRESFR) are observed ahead of the surface front. This is caused by the warm- air advection in the transition zone. A slower change in pressure occurs after FROPA. The pressure behind the surface front may fall slowly, rise slowly, or remain steady because of weak temperature advection.
Winds turn cyclonically across the frontal trough and veer with frontal passage.
Vertically, the frontal surface slopes, over the colder air mass. The frontal surface is identified as the warm side of the transition zone. The upper front at 850mb marks the intersection of the frontal surface with the 850mb constant- pressure surface. Appreciable cyclonic turning is usually found in this region. Above the 850mb level, a well-defined frontal trough may not be found. Strong fronts are clearly defined up through 700mb. Weak fronts are normally best defined at 850mb and below. The slope of a warm front is typically between 1/100 and 1/300. Fronts with steep slopes generally are visible up to 700mb, but may be reflected up to 500mb. Shallow fronts normally extend only up to 850mb, not above.
An upper-air sounding originating on the cold air side of the surface front will exhibit veering winds in the vertical within the stable layer. (Recall: The wind veering with increasing height suggests warm-air advection.)
Warm Front Characteristics
Warm fronts generally move more slowly than cold fronts. The speed with which the colder air mass retreats determines the speed at which the warm front advances. The movement of the warm front and the strength of the upward vertical motion caused by warm air gliding up the frontal surface (overrunning) are closely related. If the colder air mass is retreating as rapidly as the warmer air mass is advancing, then there is little lift along the frontal surface, thus little or no precipitation occurs. If the colder air mass is retreating slowly, but the warmer air mass is advancing rapidly, then the warm air ascends the frontal surface and widespread precipitation occurs.
The cloud sequence ahead of a warm front with significant overrunning follows a normal routine. As the surface front approaches, CI, CS, AS and finally NS (ST) clouds appear.
The precipitation sequence as the warm front approaches will depend on the time of year and whether the temperature of the retreating colder air mass is below freezing. If the temperature of the colder air mass is below freezing, then the precipitation sequence as the warm front approaches is as follows:
Snow falls well ahead of the front, where the air is below freezing throughout the column.
Ice pellets fall where the warm layer aloft is deep enough to partially melt the falling precipitation.
• Freezing rain occurs where the warm layer aloft is deeper and surface temperatures remain below freezing.
• Rain and/or drizzle occurs near the front where the warm layer extends to the ground.
If the temperature of the cold air is well above freezing, then a large area of light rain will occur ahead of the front. Fog is often observed near the front.
Not every warm front will have the weather patterns described above. If the air is very dry, or the upward vertical motion is weak, only high cloudiness may be present. Next, we will examine occluded fronts.
Occluded Fronts

Cold Type Occlusion
Cold type occlusions occur where the coldest air is found behind the occlusion. They are normally located within the thermal ridge on the thickness chart. This type of occlusion will appear on the surface as an extension of the cold front poleward on the warm front and wrapping into the baroclinic low. Cold occlusions form when the cold front overtakes the warm front, lifting both the warm air behind the warm front and the cool air ahead of it.
Cold occlusions are quite common over the eastern portions of continents and western ocean areas in the winter. In the summer, they may be found along the west coast of continents where the ocean air is colder than the relatively warmer air over the continent.
Warm Type Occlusion
Warm type occlusions occur where the coldest air is located ahead of the occlusion. They are normally located behind the thermal ridge on the thickness chart. On the surface, this type of occlusion will appear as an extension of the warm front, poleward of the surface cold front, wrapping into a baroclinic low. They form where the cold front and the cool air behind it are forced aloft, over the warm frontal surface.
Warm occlusions are quite common over the western portions of continents and eastern ocean areas during the winter months. In the summer, they may also be found along the east coasts of continents and western ocean areas, where the continental air is relatively warmer than that of the air found over ocean areas
Occlusion Characteristics
When identifying occlusions, one must keep in mind the following:
- Temperature structure varies with each type of occlusion.
- Winds veer with the passage of the occlusion.
- Winds ahead of the occlusion are typically from the east or southeast, whereas winds behind the occlusion will be from the southwest or west.
- The occlusion will be found in or near the thickness ridge.
- Occlusion structure can vary greatly. Vertical motion and latent heat release can substantially affect the thermal pattern associated with the occlusion.
Jet Stream Relationship
Besides the above mentioned characteristics, it is vitally important to examine the jet stream relationship to the occlusion. As you know, baroclinic lows at the surface normally form along the polar front, which is located equatorward (-n side) of the polar front jet, and move under the jet while undergoing self-development. As the system matures, it migrates poleward (+n side) of the polar front- jet as an occluding system. The jet, during the occluding stages, normally takes on one of two configurations as described by Petterssen and Smebye, 1971. These two configurations, which we will examine, are the Type “A” and Type “B” systems. Type “A” systems are a result of meridional trough cyclogenesis. This type of cyclone formation occurs along the east coast of the United States and over the western Atlantic. It occurs along a frontal wave in the absence of an upper level trough. This type system begins its formation at the surface. (Bluestein, page 7, 1993) The primary driver is low level thermal advection resulting in maximum baroclinicity. In a Type “A” system, the jet axis crosses the occlusion as a well-defined band of strong winds. The system develops from a frontal wave in which the upper level system either does not close off, or is just barely closed. The jet axis remains uniform and intact. The axis will cross the occlusion at or just north of the triple point (where warm, cold and occluded fronts intersect).

Satellite imagery of a Type “A” system indicates the baroclinic zone cirrus is well developed and remains on the -n side of the jet axis. (Area “A” in the diagram) The jet crosses the occlusion near the triple point. The vorticity comma cloud (an area of low and/or mid level cloudiness caused by the upward vertical motions ahead of the vorticity maxima) is visible on the +n side of the jet axis. (Area “B” in the diagram). The deformation zone cirrus is sparse and there is a definite distinction between this warmer, lower cirrus and the colder, higher baroclinic zone cirrus. (Area “C” in the diagram). Because of the distinct difference noted between each of the cloud formations, all fronts will be easiest to locate with this type of system.
Type “B” systems form in response to differential vorticity advection associated with an upper level short-wave disturbance. This is a product of slit-flow cyclogenesis, which is the most prevalent form of cyclogenesis over the central United States just east of the Rocky Mountains. Formation begins at the mid-levels. In a Type “B” system, the jet does not cross the occluded front intact. As with a Type “A” system, initially the jet axis is well defined along the front. Latent heat release within the region of overrunning precipitation warms the baroclinic region beneath the jet. The strongest baroclinicity then shifts poleward beneath the warm frontal cloud band. As this baroclinicity is lost, the jet wraps in toward the upper-level low center and a new jet segment forms farther poleward of the warm front in the region of strongest baroclinicity. The old jet, farther south, weakens. An intense short wave ridge develops in the upper levels ahead of the system and tends to wrap westward around the low This circulation forms when a well-defined closed upper low is present.
On satellite imagery, the Type “B” system differs from the Type “A” in several distinct ways. The baroclinic zone cirrus is well developed and remains on the -n side of the jet axis. Where the jet has begun to “fan out” (Area “A”), the baroclinic zone cirrus will have a less defined border. The vorticity comma cloud (Area “B”) is occasionally visible behind the baroclinic and deformation zone cirrus. Deformation zone cirrus (Area “C”) is widespread, well developed and merges with the baroclinic zone cirrus. Fronts are more difficult to locate than with a Type “A”, due to the lack of separation in the cloud features. The gradient supporting the warm front has been weakened by the latent heat release, making warm front placement extremely difficult.
Not every front moves very quickly either. Next we’ll examine the stationary front.
Stationary Fronts
Stationary Front Structure. A front which exhibits little or no movement is a stationary front. This front is not truly stationary but more quasi-stationary (movement less than 5 knots) It is located in regions where there is no further appreciable movement of the cold air equatorward or the warm air poleward. A horizontal temperature discontinuity exists across the frontal surface, with warm air on one side, and cold air on the other.

The surface front will be found on the warm side of the transition zone on the thickness chart. On the surface chart it lies in a frontal trough.
The winds aloft are nearly parallel to the front (and hence the transition zone) so little temperature advection occurs.
Small-scale influences concentrate frontal lift near the surface front. The frontal surface slopes up over the colder air mass and is identified as the warm side of the transition zone.
An upper-air sounding originating on the cold side of the surface front will exhibit light winds within the transition zone. Light winds suggest weak temperature advection.
Weather Associated With Stationary Fronts
Stratiform cloudiness and precipitation are generally confined to the cold air side of the front. Cumuliform cloudiness and precipitation can occur on either side of the front. Whether it is present or not depends on the stability of the warm air mass.
Air Mass Stability And Frontal Weather
The stability of the warmer air mass (which is lifted) determines whether cloudiness is predominantly stratiform or cumuliform. Unstable air, forced to rise, results in the development of convective clouds and showery precipitation. The more unstable the air mass, the more intense the convection. Stable air, forced to rise, leads to the development of stratiform clouds and steady precipitation. The best tool for learning the stability of an air mass is the Skew-T/Log P diagram.

Weather and cloud type reported in an area also show stability. When using weather and cloud type, be careful to consider which air mass is involved in the report. A report of a thunderstorm within the cold air 28 miles north of a surface warm front shows the warmer air mass is unstable. The deep convective cloud exists in the warm air aloft and not the cold air presently near the surface.
Recent Posts
Determining Severe Weather Based On Stability Indexes and Upper-Level Winds
There are several weather products used to determine the possibility of severe weather for an area. The most common and misunderstood by many weather enthusiasts is the Skew-T chart and the upper-air...
Tornado Basics, Severe Weather Preparation, & The Enhanced Fujita scale
Earth's weather can produce various kinds of windstorms which include waterspouts, dust devils and tornadoes. Although they have the common features of a column of rotating air, they are actually...