
Have you ever heard “It’s not the heat, it’s the humidity”? Well, it is actually both the heat AND the humidity. There are some places around the world that are considered hot. But just heat alone does not make high temperatures a threat.
If you search for photographs of severe weather, you are not likely to find many of heat waves like you would of tornadoes, hurricanes, and floods. They don’t tend to have the same visual effect as other natural disasters.
Heat waves are not easily photographed, like the destruction of tornadoes, hurricanes and floods and therefore tend to not have the same visual impact as these other disasters. Yet, heat waves kill more people in the United States than all of the other weather-related disasters combined. The 10-year average (2005-2014) for heat related deaths in the U.S. is 124 in a typical year.

Summertime weather patterns are generally slower to change than in winter. As a result, this mid-level high pressure also moves slowly. Under high pressure, the air subsides (sinks) toward the surface. This sinking air acts as a dome capping the atmosphere.
This cap helps to trap heat instead of allowing it to lift. Without the lift there is little or no convection and therefore little or no convective clouds (cumulus clouds) with minimal chances for rain. The end result is a continual build-up of heat at the surface that we experience as a heat wave.
Our bodies dissipate heat by varying the rate and depth of blood circulation, by losing water through the skin and sweat glands, and, as the last extremity is reached, by panting. As the body heats up, the heart begins to pump more blood, blood vessels dilate to accommodate the increased flow, and the tiny capillaries in the upper layers of skin are put into operation.
The body’s blood is circulated closer to the skin’s surface, and excess heat drains off into the cooler atmosphere by one or a combination of three ways…
- Radiation
- Convection
- Evaporation
At lower temperatures, radiation and convection are efficient methods of removing heat. However, once the air temperature reaches 95°F (35°C), heat loss by radiation and convection ceases. It is at this point that heat loss by sweating becomes all-important. But sweating, by itself, does nothing to cool the body, unless the water is removed by evaporation (sweat changing to water vapor). The downside of this method of cooling is that high relative humidity retards evaporation.
This exerted pressure is dependent upon the air temperature and is the “relative” in relative humidity. As the air temperature changes, the ratio of pressure exerted by water vapor, present in the atmosphere, varies as does the pressure that would be exerted if the air was saturated with water vapor.
For example, a relative humidity of 50% means the pressure exerted by water vapor in the air is ½ of what the pressure would be if the air was completely saturated with water vapor. It is not the best way to measure the amount of moisture in the atmosphere but the use of Relative humidity is broad.
The same amount of water vapor in the air results in higher relative humidity in cool air as compared to warmer air.
So, what does this all mean? Sweat is evaporated (changes from a liquid to a gas, i.e. water vapor) when heat is added. The heat is supplied by your body. The results are summed up in the table below…
| Relative Humidity | Amount of Evaporation | HEAT removed from the body | We feel |
| High | Lower | Less | Less Comfortable |
| Low | Higher | More | More Comfortable |
If you have ever walked outside and thought, it feels like 100 degrees out here when the temperature is only 88 degrees. This is the reason the heat index chart was developed.
The Heat Index is based on work by R.G. Steadman and published in 1979 under the title “The Assessment of Sultriness, Parts 1 and 2.” In this work, Steadman constructed a table which uses relative humidity and dry bulb temperature to produce the “apparent temperature” or the temperature the body “feels”.
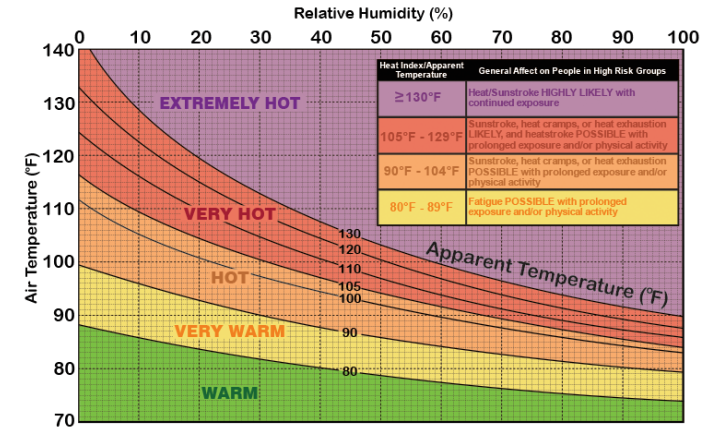
We use this table to provide you with Heat Index values. These values are for shady locations only. Exposure to full sunshine can increase heat index values by up to 15°F (8°C). Also, strong winds, particularly with very hot, dry air, can be extremely hazardous as the wind adds heat to the body. The Heat Index Chart is below.

How to read the chart…Follow the temperature line until it intersects the relative humidity line. Then read the Heat Index on the curved line. For example, an air temperature of 100°F (38°C) and Relative Humidity of 40%. Follow the 100°F (38°C) temperature line until it intersects the 40% relative humidity line. Then curved line that also intersects is the Heat Index of 110°F (43°C), or Very Hot.
That is the temperature the body thinks it is and attempts to compensate for that level of heat. Remember, these values are in the SHADE. You can add up to 15°F (8°C) to these values if you are in direct sunlight.
The chart below tells you the risk to the body from continued exposure to the excessive heat.


Recent Posts
Determining Severe Weather Based On Stability Indexes and Upper-Level Winds
There are several weather products used to determine the possibility of severe weather for an area. The most common and misunderstood by many weather enthusiasts is the Skew-T chart and the upper-air...
Tornado Basics, Severe Weather Preparation, & The Enhanced Fujita scale
Earth's weather can produce various kinds of windstorms which include waterspouts, dust devils and tornadoes. Although they have the common features of a column of rotating air, they are actually...