
To further understand frontal systems and the atmospheric dynamics, refer to the article on air masses and their source regions. In this article, I am going to discuss frontal systems and their depictions on weather charts. Fronts are the separation between air masses and the leading edge of an air mass. There are various types of fronts and their related symbols as depicted on weather charts.
Terminology & Definitions Associated With Frontal Zones
Air Mass – A large body of air with similar horizontal temperature and moisture (density) characteristics. Skew-T soundings throughout the air mass will be similar.
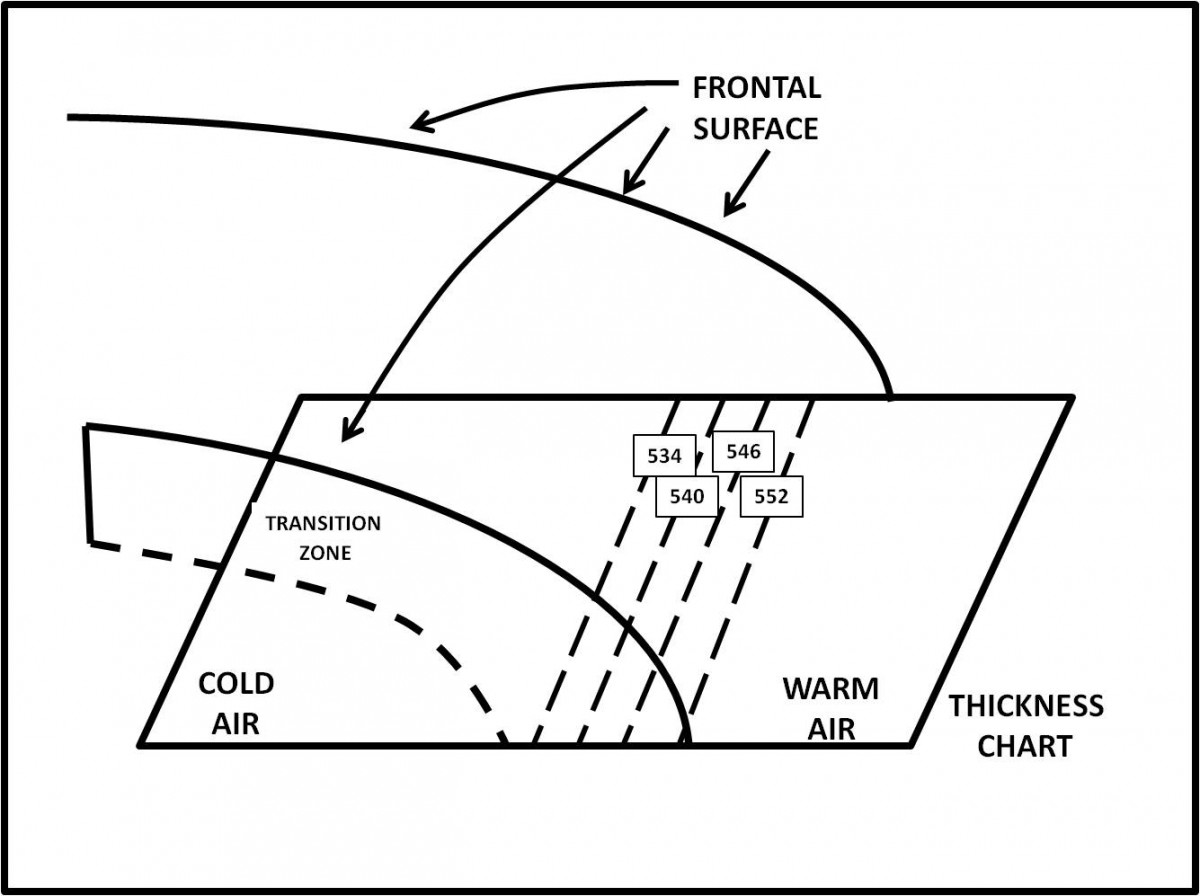
Transition Zone (frontal zone) – A region of large horizontal temperature contrast between two air masses. The transition zone is characterized by a packing of thickness lines and isotherms (often called the thermal ribbon).

Frontal Surface – The boundary separating one air mass from another. Across the frontal surface, distinct contrasts in temperature, moisture, and wind exist. The frontal surface is along the warm side of the transition zone.

Surface Front – The intersection of the frontal surface and the ground. The term “front,” by itself, generally refers to a surface front.
Frontal Surface Aloft – is known as the upper front.
Boundary – is a feature which separates two air masses. Frontal surfaces, mountains and transition zones themselves can serve as boundaries between air masses. Troughing in the contours or isobars which is coincident with the frontal surface is known as a frontal trough. The frontal trough is most distinct at low levels.
The region depicted on a Skew-T sounding which corresponds to the transition zone is called the stable layer. The stable region could have a negative, isothermal or weak positive lapse rate. This feature is commonly called a frontal inversion. However, a true inversion need not be present. The base of the stable layer is the cold side of the transition zone. Below the stable layer lies the colder air mass. The top of the stable layer is the frontal surface. Above the top of the inversion lies the warmer air mass. The dew-point curve will follow the temperature curve and show a moisture increase with height through the transition zone. A change in temperature and moisture represents a change in virtual temperature. This, in turn, corresponds to the density difference across the front.

The frontal movement is strongly influenced by the perpendicular wind component in the cold air. The stronger the perpendicular component, the faster the front moves. A general rule of thumb is 50% of the 500mb wind or 70% of the 700mb winds.


A very important characteristic of a frontal surface is its slope. The slope is defined as RISE over RUN. Frontal slope is the ratio of the height of the upper front at some location (RISE) to the distance between that location and the surface front (RUN).
Frontal slope is significant because it represents the POTENTIAL lift in a frontal zone. The ACTUAL lift depends on the wind flow in the frontal region. A steep slope suggests the frontal lift could be strong thus the wind flow forces air to ascend ahead of the frontal surface. A shallow slope suggests the frontal lift would be weak, thus the wind flow allows air to ascend the frontal surface.
The typical result of a steep slope is that the weather is ahead of the front and a shallow slope the weather is at and behind the front. A steep slope will likely be a fast moving front, while a shallow slope is typically slow moving front. The severity of the weather associated with each front can be equally threatening, but the weather associated with a slow moving front has more time to build and can become more severe and live longer.
While viewing diagrams of fronts, it is important to realize the drawings are not to scale. The actual slope of a frontal surface is much less pronounced than normally depicted on diagrams. If drawn to scale, even a steep front would have a slope which is hard to detect. A slope of 1/20 drawn to scale means that over a distance of 20 inches in the horizontal, the line changes only 1 inch in the vertical. In the planetary boundary layer, frontal slope is much steeper. Fast moving fronts may have an almost vertical slope in the boundary layer because of frictional drag. The slope shown below is 1/50. A front with this slope would be considered steep!!
Determination of Frontal Slope
When measuring the height of the frontal surface (RISE), several approximations are used: 5000 ft = about 1 mile, the 850-mb level is 1 mile high. and 700-mb level is 2 miles high. This is valid in the eastern U.S., or wherever terrain is near sea level. In the elevated regions of the West, the 850mb level is the surface and the 700-mb level is 1 mile high. When measuring the horizontal distance (RUN) from the surface front to the location beneath the upper front, the following approximation is used: one degree of latitude is equal to 60 nautical miles. To account for the distortion which is built into the map projections used on weather charts, it is important that the number of degrees of “run” be estimated at the same latitude that the measurements were taken.
The stack of the weather system that the front is associated with will be good indicator of how strong the system is. Another indicator is the association and location of the jet in regards of the front. The Jet stream can act as a siphon and pull air air moisture aloft causing the system to intensify.

This will all be covered more thoroughly is later article covering the evolution of frontal systems and factors the affect frontal intensities.
Recent Posts
Determining Severe Weather Based On Stability Indexes and Upper-Level Winds
There are several weather products used to determine the possibility of severe weather for an area. The most common and misunderstood by many weather enthusiasts is the Skew-T chart and the upper-air...
Tornado Basics, Severe Weather Preparation, & The Enhanced Fujita scale
Earth's weather can produce various kinds of windstorms which include waterspouts, dust devils and tornadoes. Although they have the common features of a column of rotating air, they are actually...